This paper outlines a set of practices to increase trust and reliability in text-to-SQL applications in analytics.
Unlocking Analytical Potential

The promise of AI in data analysis is immense. Tools that convert natural language into SQL queries can democratize access to complex data, allowing more users to derive insights without needing specialized coding skills. This capability is poised to transform how organizations leverage their data, leading to faster decision-making and more robust strategic planning.
More Than Just a Simple Prompt
Despite the excitement, the reality is that generating reliable SQL from natural language is not as straightforward as it might seem. Simply asking a large language model (LLM) like ChatGPT or Databricks Genie to "write a query" often yields results that require significant refinement or lack the nuanced understanding necessary for complex data environments.

For an LLM to consistently produce effective and trustworthy queries, it must be prepared and guided in much the same way a human analyst would be. This involves providing context, understanding data structures, and establishing clear objectives for the query.
Understanding the Challenge: Bridging the Gap in Text-to-SQL
The promise of natural-language-to-SQL (text-to-SQL) is immense: to democratize data access and multiply analytical output. However, achieving trustworthy results from LLMs in this domain isn't as straightforward as typing a simple prompt. It requires a nuanced understanding of what these powerful AI models truly know and what they don't.
What LLMs Know and Can Do

LLMs possess an impressive breadth of knowledge and several key capabilities that are relevant to text-to-SQL:
- Extensive Knowledge Base: They understand typical structures and content found in common datasets, such as healthcare claims and EHRs.
- SQL Syntax Mastery: LLMs are highly proficient in writing syntactically correct SQL queries across various dialects.
- Pattern Recognition: They can identify general patterns and relationships in data based on their training.
What LLMs Don't Know and Can't Do
Despite their vast capabilities, LLMs operate without the context of your specific organizational environment. This lack of domain-specific knowledge creates significant blind spots:
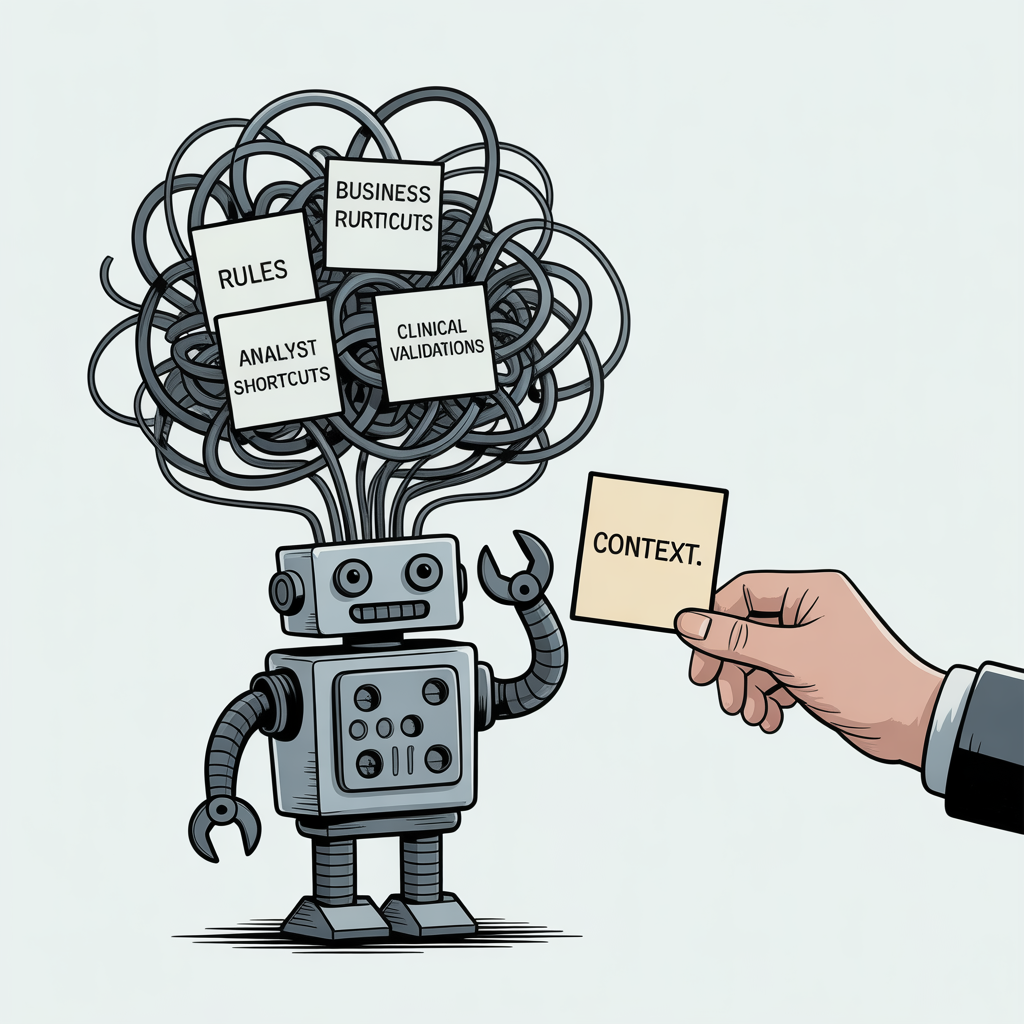
- Organizational Business Rules: They are unaware of your company's unique business logic, compliance requirements, or data governance policies.
- Analytical Conventions: LLMs don't understand the shortcuts, conventions, or specific methodologies your experienced analysts apply.
- Clinical Validations: In fields like healthcare, they lack knowledge of critical clinical validations and nuanced interpretations that human experts perform daily.
The output from an LLM, though syntactically correct, might miss critical assumptions and lead to misleading or incorrect insights without this context.
The Human Analyst Analogy: Providing Context for Success
Consider how a new human analyst is integrated into your team. You wouldn't simply hand them raw tables and expect immediate, insightful analysis. Instead, you provide a comprehensive onboarding that includes:
- Thorough Documentation: Access to data dictionaries, process flows, and best practices.
- Past Work Examples: Reviewed and validated analyses to illustrate conventions.
- Rules of Thumb: Guidance on data trustworthiness, common pitfalls, and critical assumptions.
- Credibility Requirements: Clear standards for validating results and ensuring accuracy.
This context is essential for a human analyst to produce reliable and trustworthy results.
Empowering LLMs: Orientation and Guardrails
LLMs require the same level of preparation and contextualization to perform like your best human analysts. To truly harness their power for text-to-SQL, you must provide:
- Clear Orientation: Guiding the LLM with detailed information about your data schema, relationships, and business logic.
- Robust Guardrails: Implementing mechanisms to enforce business rules, validate outputs, and prevent common errors.
- Worked Examples: Supplying high-quality, validated examples of queries and their intended results to fine-tune the LLM's understanding.
By thoughtfully integrating these elements, organizations can move beyond basic text-to-SQL and unlock a new era of trustworthy, AI-powered analytics.
Related article: context infrastructure as an element of the modern analytics stack to capture the institutional knowledge that AI needs to code reliably
Four Prerequistes of AI-Ready SQL
Effective "LLM onboarding" is crucial for maximizing the potential of LLMs in your data analytics workflows. You'll find consistent themes across enterprise text-to-SQL tools from major cloud providers and data warehouses.
In our experience, four essential pillars stand out for preparing for text-to-SQL AI. These elements ensure LLMs can move beyond simple demonstrations to become trusted, production-ready tools. Each pillar section includes an example of the kind of documentation your teams should produce to make your environments truly AI-ready.
1. Schema Hygiene & Metadata
Consistent table and column names, coupled with clear business definitions, are paramount. This allows the model to accurately understand the actual meaning behind your data fields.
Why this matters: just like human analysts, AI needs to know what the contents of raw tables are. What do the columns mean, what does a single record represent. This is "atomic" knowledge.
Consider healthcare data, for example. You might encounter 837 insurance claims data in various formats:
- Classic header and line detail
- Partially normalized forms (header, procedure, provider, payer, diagnosis, etc.)
- OMOP format
While the core content remains consistent, the structural form can differ significantly across these formats.
An LLM needs to clearly understand:
- What your tables genuinely represent.
- The real-world meaning of each field.
- Any important considerations or nuances about the data itself.
Including a comprehensive Excel data dictionary within your prompt chain is an effective way to ensure the LLM knows how the formal structure of your data relates directly to its contents and context.
Example: 837 submit dataYour organization should be able to generate clear documentation for the content of your data. An LLM will know what an 837 submit is, but how you organize it, structure it, and what information it needs to know about the sourcing (e.g. sourced from Komodo Health vs. sourced from Merative Marketscan, and what that implies about its usage) is context an LLM does not have. Here's an example.
| Column Name | Data Type | Description | Example Value |
|---|---|---|---|
| claim_id | VARCHAR(20) | Unique identifier for each submitted claim. Links to header table claims_header. | CLM87459621 |
| patient_id | VARCHAR(20) | Encrypted or surrogate identifier for the member/patient. | P1002394 |
| service_date | DATE | Date of service associated with the diagnosis. | 2024-04-18 |
| diagnosis_rank | INTEGER | Order of diagnosis on the claim (1 = primary, higher = secondary). | 1 |
| icd10_code | VARCHAR(10) | ICD-10 diagnosis code reported. | E11.9 |
| icd10_description | VARCHAR(255) | Text description of the diagnosis code. Added by organization. | Type 2 diabetes mellitus without complications |
| claim_type | CHAR(2) | Type of claim: 'IP' (inpatient), 'OP' (outpatient), 'PB' (professional). | PB |
| billing_provider_npi | VARCHAR(15) | National Provider Identifier of billing provider. See attached document for full reference. | 1467598390 |
| payer_claim_control_num | VARCHAR(30) | Control number used by the payer for claim tracking. | CN5421881 |
| place_of_service | VARCHAR(3) | CMS Place of Service code (e.g., 11 = Office, 21 = Inpatient hospital). | 11 |
Plain-Language Summary
Each row represents a diagnosis line from an 837 transaction.
Primary key = (claim_id, diagnosis_rank).
Used to identify disease onset dates, comorbidities, and claim-level disease groupings. Note: the presence of a diagnosis code indicates that an HCP may either be rendering a diagnosis or recording a previous condition.
Transactions in this dataset are sourced from an open-network dataset, meaning that data is observed from transactions between providers and payors via the provider. This source may not observe all transactions that a particular provider generates, and will certainly not guarantee observation of all transactions for a given patient.
2. Semantic Definitions
Codify your organization's critical business rules into analysis-ready views or models. These curated views serve to abstract away unnecessary noise and embed complex logic in a reusable, standardized form.
Why this matters: if your organization has already done the hard work of defining metrics or attributes, make that defining information available to LLMs so the know when and how to rely on your derived data instead of inventing something new.
Any attributes or metrics that are defined and standardized by your organization should be populated in a way that allows LLMs to:
- Easily observe their definitions.
- Access these organization-generated attributes and metrics directly.
For instance, if your organization calculates "line of therapy" using a specific methodology that includes:
- Consistent definitions for start dates.
- Rules for continuation and treatment stoppage.
- Considerations for adjunct therapies.
- Medication possession data.
- Defined buffer periods.
It is best practice to create a dedicated view that incorporates these attributes. Additionally, make the underlying definitions readily available. This dual approach enables the LLM to both retrieve pre-calculated results you already trust and understand the definitions for its own analytical tasks.
Example: Continuous Coverage (No Enrollment File)Your organization may have a standard approach for estimating patient coverage in your data, especially when your data source is not generated from a source that can guarantee coverage.
In open claims data, we infer “continuous coverage” by observing consistent claim activity across calendar years.
A patient is considered continuously covered if they have ≥1 medical claim in each consecutive 12-month period within the analysis window. We have reached this definition after observing that this subset of the population triangulates to many other well-known metrics of the population that encounters the healthcare system in a given year.
CREATE OR REPLACE VIEW v_continuously_observed_patients AS
SELECT patient_id
FROM (
    SELECT patient_id,
           COUNT(DISTINCT EXTRACT(YEAR FROM service_date)) AS active_years
    FROM claims_header
    WHERE service_date BETWEEN '2019-01-01' AND '2024-12-31'
    GROUP BY patient_id
) a
WHERE active_years = 6;  -- patient appears in all 6 calendar years
Plain-Language Description
Because we lack enrollment data, we approximate continuous coverage by confirming that a patient generates at least one paid claim per year.
This increases the likelihood that patients included in analyses are observable throughout the study period, minimizing bias from drop-outs or data gaps.
In general, the patient populations that we study have a high disease burden and therefore we expect them to generate at least one claim per calendar year, either due to treatment or routine check-ups to monitor an ongoing condition.
3. Golden Queries
Develop a comprehensive library of canonical, well-commented example queries for your most frequent and critical business questions.
Why this matters: in the same way that a human analyst learns by observing how others code and having their code corrected by more seasoned colleagues, it's best practice to provide examples of "what good looks like." It gives LLMs a safe base to mine when asked a question, instead of dreaming up a query based on what it's consumed from the internet.
Each example query should clearly include:
- The specific business question it addresses.
- All underlying assumptions made.
- Any relevant data boundaries or scope limitations.
LLMs leverage this context to map new questions to relevant patterns and solutions, even when the phrasing or wording of the new question differs from the examples.
Consider the behavior of an experienced human analyst when faced with a novel problem:
- They often review previous work.
- They identify similar problems they've already solved.
- They then reuse or adapt an existing query.
LLMs operate similarly. Collate numerous examples of successful, production-grade queries from your team into a structured table, with one query per row. Augment this table with additional columns to enrich each query with metadata that helps an LLM accurately assess similarity for new requests.
Examples of useful metadata include:
- Disease type (for healthcare data).
- Project type or name.
- The specific purpose or objective of the query.
This table effectively functions as a "memory" for your LLM, guiding it to generate queries that align with your team's established coding standards and analytical style.
Example: Time from First Diabetes Diagnosis to First Insulin UseYour organization should generate clear code and plain-language documentation of codes that are representative of common analytics. Here is a medium-complexity example.
WITH params AS (
  SELECT
    DATE '2019-01-01' AS study_start,
    DATE '2024-12-31' AS study_end,
    365::INT            AS prestudy_days  -- require activity here; forbid insulin here
),

prestudy_window AS (
  SELECT
    study_start,
    study_end,
    prestudy_days,
    (study_start - (prestudy_days || ' days')::INTERVAL) AS prestudy_start
  FROM params
),

-- 1) First diabetes diagnosis INSIDE the study window
first_diabetes_in_study AS (
  SELECT
    cd.patient_id,
    MIN(cd.service_date) AS first_diabetes_dx_date
  FROM claims_diagnosis cd
  CROSS JOIN params p
  WHERE (cd.icd10_code LIKE 'E10%' OR cd.icd10_code LIKE 'E11%')
    AND cd.service_date BETWEEN p.study_start AND p.study_end
  GROUP BY cd.patient_id
),

-- 2) Exclude anyone with ANY diabetes diagnosis BEFORE the study start
no_prior_diabetes AS (
  SELECT f.patient_id, f.first_diabetes_dx_date
  FROM first_diabetes_in_study f
  CROSS JOIN params p
  WHERE NOT EXISTS (
    SELECT 1
    FROM claims_diagnosis cd_prev
    WHERE cd_prev.patient_id = f.patient_id
      AND (cd_prev.icd10_code LIKE 'E10%' OR cd_prev.icd10_code LIKE 'E11%')
      AND cd_prev.service_date < p.study_start
  )
),

-- 3) Require ACTIVITY in pre-study window AND NO INSULIN fills in that window
prestudy_activity_ok AS (
  SELECT n.patient_id, n.first_diabetes_dx_date
  FROM no_prior_diabetes n
  CROSS JOIN prestudy_window w
  WHERE
    -- (a) at least one claim in pre-study window
    EXISTS (
      SELECT 1
      FROM claims_header ch
      WHERE ch.patient_id = n.patient_id
        AND ch.service_date >= w.prestudy_start
        AND ch.service_date <  w.study_start
    )
    -- (b) no insulin fills in pre-study window
    AND NOT EXISTS (
      SELECT 1
      FROM pharmacy_claims pc
      WHERE pc.patient_id = n.patient_id
        AND pc.ndc IN (SELECT ndc FROM ref_drug_map WHERE drug_class = 'INSULIN')
        AND pc.fill_date >= w.prestudy_start
        AND pc.fill_date <  w.study_start
    )
),

-- First insulin prescription (inside study window)
first_insulin_rx AS (
  SELECT
    pc.patient_id,
    MIN(pc.fill_date) AS first_insulin_date
  FROM pharmacy_claims pc
  CROSS JOIN params p
  WHERE pc.ndc IN (SELECT ndc FROM ref_drug_map WHERE drug_class = 'INSULIN')
    AND pc.fill_date BETWEEN p.study_start AND p.study_end
  GROUP BY pc.patient_id
),

-- Final cohort: first insulin AFTER first diabetes dx
cohort AS (
  SELECT
    a.patient_id,
    a.first_diabetes_dx_date,
    r.first_insulin_date
  FROM prestudy_activity_ok a
  JOIN first_insulin_rx r
    ON r.patient_id = a.patient_id
  WHERE r.first_insulin_date > a.first_diabetes_dx_date
)

SELECT
  COUNT(*) AS patient_count,
  AVG(DATEDIFF(DAY, first_diabetes_dx_date, first_insulin_date)) AS avg_days_to_insulin
FROM cohort;
Plain-Language Summary
Calculates the average number of days between a patient's first qualifying diabetes diagnosis and their first insulin prescription, among those continuously observed during the study period.
Assumptions & Metadata
- We index first-time diabetes diagnoses within the study period.
- We exclude anyone with any diabetes diagnosis or insulin fill before the study start. The latter is included as an extra precaution against missing a diagnosis code because either a patient didn't encounter the healthcare system but was diagnosed, or because our claims source didn't observe it.
- We require observability by demanding ≥1 claim in the pre-study window.
- Finally, we measure days from first diabetes dx to first insulin fill (both within the study period, and insulin must occur after diagnosis).
4. Guardrails
Implement clear constraints and guidelines that limit the scope of LLM operations, prevent costly errors, and ensure the model consistently adheres to your organization's trusted practices.
Why this matters: there are certain queries or code snippets that may get used frequently for analytical purposes but are not metrics or attributes. Golden queries tell an LLM "here are trustworthy examples of how we calculate certain things." Guardrails tell an LLM "when we analyze data, here are some steps we take to facilitate our analyses." Separating them tells an LLM that it needs to consider how to calculate and how to treat/limit data as two separate categories.
Examples of essential guardrails include:
- Lists of approved tables for query generation.
- Defined time windows for data analysis.
- Strict join policies between tables.
- PHI-safe patterns to protect sensitive information.
Reflect on the best practices your teams have meticulously developed over years of experience:
- Do you typically avoid data generated before a certain date?
- Does your data provider intentionally exclude specific data points?
- Are there known instances of missing data due to the inherent nature of your data source?
- Are there documented problems or caveats when connecting certain tables or datasets?
All these critical best practices and limitations must be clearly recorded and made available for your LLM to follow the same established direction. Even a simple document, such as a Word document with bullet points outlining each guardrail, can be sufficient.
Example: COVID Period Handling Policy re: Continuous CoverageYour organization may have a policy for how to handle continuous coverage calculations in a way that adapts to the major disruption that occurred during the COVID pandemic. Ideally you'd build this into a semantic layer so that it's "ground truth" for your people and your AI, but that's not always how analytics teams work in the real world. Here's how you might document that in both plain English and code.
- Goal: Avoid falsely classifying members as “not continuously observed” due to pandemic-driven utilization drops.
- Rule: When requiring pre/post observation via “≥1 claim per calendar year,” don't penalize months that fall inside the COVID window (e.g., 2020-03-01 → 2021-06-30).
- Effect:
- If a year is entirely inside the COVID window, waive the activity requirement for that year.
- If a year partially overlaps the COVID window, require ≥1 non-COVID claim in the remaining (non-COVID) months to count that year as “observed.”
- Scope: Applies to any logic that uses activity to establish “observability” (e.g., pre-study activity, study-period continuity checks, post-index follow-up).
- Documentation: Every cohort derivation that uses activity-based continuity must record (a) the COVID window used, (b) the number of waived years, and (c) member-level flags used in eligibility.
Reference Configuration (one place to change dates)
-- COVID window is configurable and audited here
CREATE OR REPLACE VIEW covid_window AS
SELECT
  DATE '2020-03-01' AS covid_start,
  DATE '2021-06-30' AS covid_end;
COVID-Aware Continuous Observation View
This view implements “≥1 non-COVID claim per year, except years wholly inside COVID window are waived.”
-- Parameters for the study horizon (reused everywhere)
WITH params AS (
  SELECT
    DATE '2019-01-01' AS study_start,
    DATE '2024-12-31' AS study_end
),

-- Enumerate calendar years in the study horizon
years AS (
  SELECT generate_series(
            EXTRACT(YEAR FROM (SELECT study_start FROM params))::INT,
            EXTRACT(YEAR FROM (SELECT study_end   FROM params))::INT
         )::INT AS yr
),

-- Expand years into non-overlapping year spans
year_spans AS (
  SELECT
    yr,
    make_date(yr, 1, 1)                    AS year_start,
    make_date(yr, 12, 31)                  AS year_end
  FROM years
),

-- Bring in COVID window
span_with_covid AS (
  SELECT
    y.*,
    cw.covid_start,
    cw.covid_end,
    -- Does this calendar year overlap COVID at all?
    GREATEST(y.year_start, cw.covid_start) <= LEAST(y.year_end, cw.covid_end) AS overlaps_covid,
    -- Is the entire calendar year inside the COVID window?
    (y.year_start >= cw.covid_start AND y.year_end <= cw.covid_end) AS fully_within_covid
  FROM year_spans y
  CROSS JOIN covid_window cw
),

-- For each patient & year, did we see ANY claim in non-COVID days of that year?
activity_non_covid AS (
  SELECT
    ch.patient_id,
    EXTRACT(YEAR FROM ch.service_date)::INT AS yr,
    TRUE AS has_activity_non_covid
  FROM claims_header ch
  CROSS JOIN span_with_covid s
  WHERE ch.service_date BETWEEN s.year_start AND s.year_end
    -- Keep only claim dates that are NOT inside COVID window
    AND (ch.service_date < s.covid_start OR ch.service_date > s.covid_end)
  GROUP BY ch.patient_id, EXTRACT(YEAR FROM ch.service_date)::INT
),

-- Decide, per (patient, year), if the year counts as "observed":
-- (1) If year fully within COVID => WAIVED = observed
-- (2) Else require ≥1 non-COVID claim in that year
year_observed AS (
  SELECT
    p.patient_id,
    s.yr,
    CASE
      WHEN s.fully_within_covid THEN TRUE
      ELSE COALESCE(a.has_activity_non_covid, FALSE)
    END AS observed_this_year
  FROM (
    SELECT DISTINCT patient_id FROM claims_header
  ) p
  CROSS JOIN span_with_covid s
  LEFT JOIN activity_non_covid a
    ON a.patient_id = p.patient_id AND a.yr = s.yr
),

-- Aggregate to member-level: all years in horizon must be observed/waived
observed_summary AS (
  SELECT
    patient_id,
    MIN(CASE WHEN observed_this_year THEN 1 ELSE 0 END) AS all_years_observed  -- 1 = yes, 0 = no
  FROM year_observed
  GROUP BY patient_id
)

-- Final view you can reuse in cohort logic
SELECT
  patient_id
FROM observed_summary
WHERE all_years_observed = 1;
How to Use It in Your Cohort
Replace any earlier “continuous coverage” proxy with the COVID-aware view.
-- Example join snippet in your cohort build
JOIN v_continuously_observed_patients_covidaware c
  ON c.patient_id = a.patient_id
By thoughtfully implementing these four essentials, tools like Databricks Genie or Snowflake Copilot can transition from intriguing toy demonstrations to powerful, trusted, and production-ready solutions within your organization.
Related article: on labelling queries to generate the above context for LLMs
The Next Frontier
These four essentials get you to good. But "good" isn't the end of the story. Leading teams are now tackling the frontier problems that separate pilots from game-changing deployments:
Complex, Multi-step Reasoning
Many questions can't be answered in one query. They often unfold across chained steps, each with its own assumptions, dependencies, and context.
Effectively handling these complex workflows is what transforms an LLM from a helpful assistant into a true analytical partner.
Spaces & Scoping
Text-to-SQL performs best when the model's focus is narrow and precise.
Dividing knowledge into well-structured domains—whether by therapeutic area, data type, or business function—ensures the model retrieves only the right context, rather than being overwhelmed with everything at once.
When executed effectively, this approach leads to AI outputs that are both faster and more trustworthy.
Cross-Team Knowledge Reuse
Most organizations possess years of valuable SQL history—including queries, validations, and even past debates. This represents hard-won institutional knowledge.
Capturing and indexing this historical data is the fastest way to accelerate value, moving from weeks to days.
The primary challenge lies in scaling this process without burdening your teams.
These frontiers are solvable—but only with a deliberate strategy for how analysts, knowledge, and AI connect. That's what we're building.
If you're ready to move from proof-of-concept to production, connect with us to see what trustworthy text-to-SQL looks like in practice.